Performs logistic regression to analyze the relationship between genetic markers and phenotype (R, and NWT) for a specified antibiotic.
Usage
amr_logistic(
  geno_table,
  pheno_table,
  antibiotic,
  drug_class_list,
  geno_sample_col = NULL,
  pheno_sample_col = NULL,
  sir_col = "pheno",
  ecoff_col = "ecoff",
  maf = 10,
  glm = FALSE,
  single_plot = TRUE,
  colors = c("maroon", "blue4"),
  axis_label_size = 9
)
Arguments
- geno_table
A data frame containing the genotype data.
- pheno_table
A data frame containing the phenotypic data.
- antibiotic
A character string specifying the antibiotic to model using logistic regression.
- drug_class_list
A vector of drug class names. Used to subset the relevant markers for analysis.
- geno_sample_col
(Optional) A character string specifying the column in
geno_tablethat identifies the sample IDs. Defaults toNULL.- pheno_sample_col
(Optional) A character string specifying the column in
pheno_tablethat identifies the sample IDs. Defaults toNULL.- sir_col
(Optional) A character string specifying the column in
pheno_tablethat contains the phenotype values (e.g., resistance/susceptibility). Defaults to"pheno".- ecoff_col
(Optional) A character string specifying the column in
pheno_tablecontaining the ECOFF (epidemiological cutoff) values. Defaults to"ecoff".- maf
(Optional) An integer specifying the minimum allele frequency (MAF) threshold. Markers with a MAF lower than this value will be excluded. Defaults to 10.
- glm
(Optional) Change to TRUE to fit model with glm. Otherwise fit model with logistf (default).
- single_plot
(Optional) A logical value. If
TRUE, a single plot is produced comparing the estimates for resistance (R) and non-resistance (NWT). Otherwise, two plots are printed side-by-side. Defaults toTRUE.- colors
(Optional) A vector of two colors, to use for R and NWT models in the plots. Defaults to
c("maroon", "blue4").- axis_label_size
(Optional) A numeric value controlling the size of axis labels in the plot. Defaults to 9.
Value
A list with three components:
- bin_mat
The binary matrix of genetic data and phenotypic resistance information.
- modelR
The fitted logistic regression model for resistance (
R).- modelNWT
The fitted logistic regression model for non-resistance (
NWT).- plot
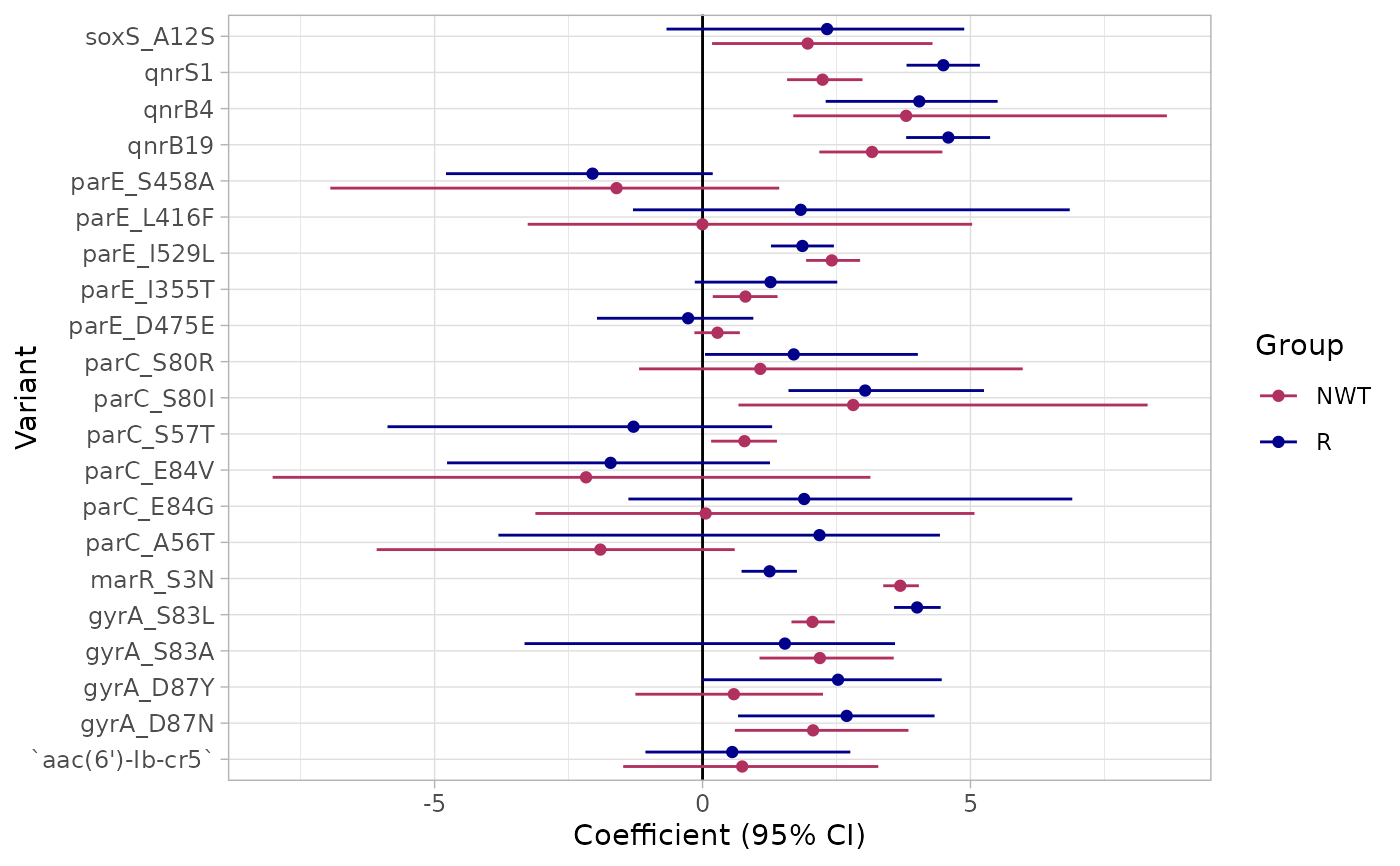
A ggplot object comparing the estimates for resistance and non-resistance with corresponding statistical significance indicators.
Examples
# Example usage of the amr_logistic function
result <- amr_logistic(geno_table = import_amrfp(ecoli_geno_raw, "Name"),
                      pheno_table = ecoli_ast,
                      antibiotic = "Ciprofloxacin",
                      drug_class_list = c("Quinolones"),
                      maf = 10)
#> Input is already a dataframe.
#> [1] "Some samples had multiple phenotype rows, taking the most resistant only"
#> [1] "Defining NWT using ecoff column provided: ecoff"
#> [1] "Fitting logistic regression models using logistf"


# To access the plot:
print(result$plot)
# To access the plot:
print(result$plot)
