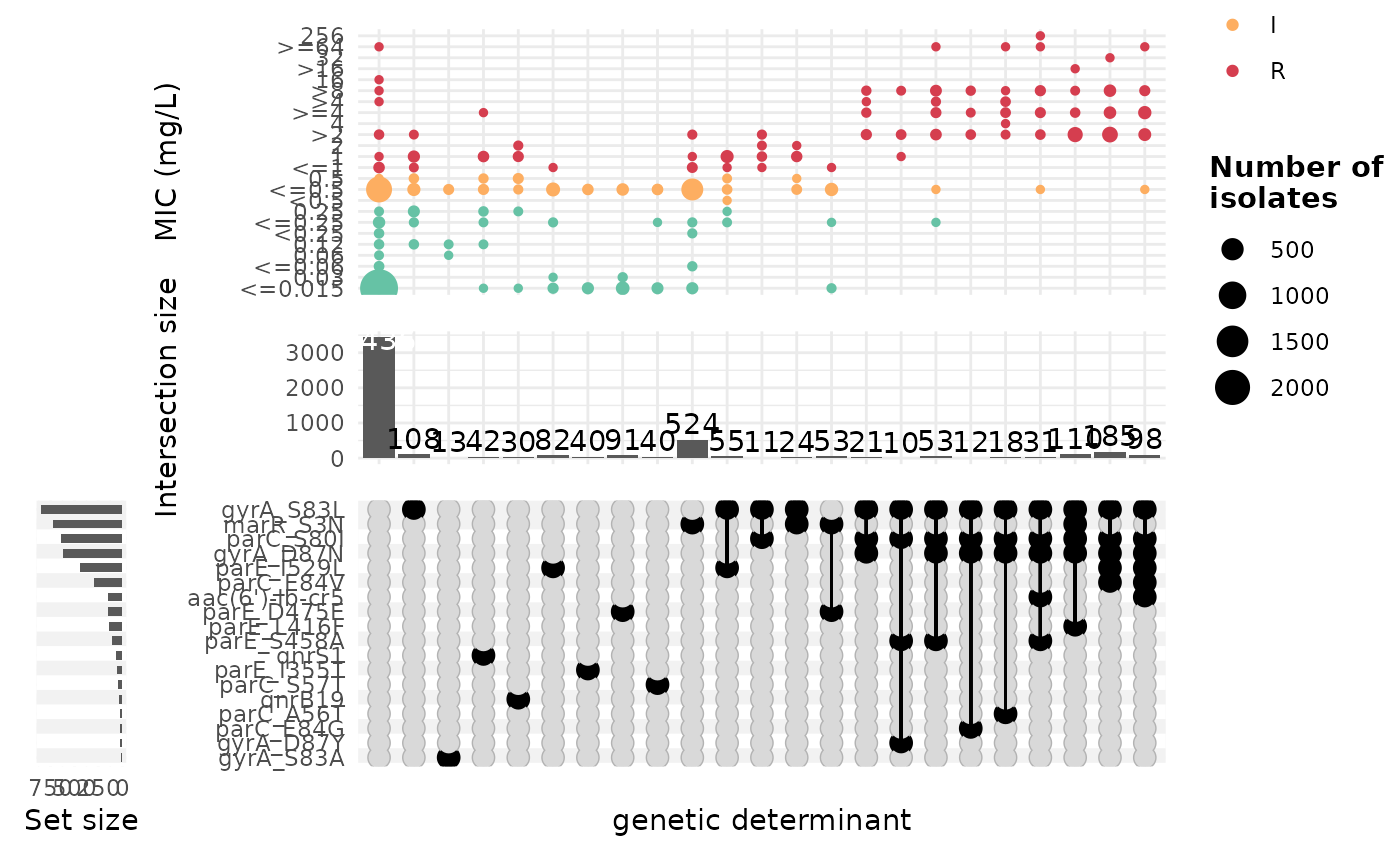
This function generates an Upset plot using a binary matrix of genetic determinants and antimicrobial resistance (AMR) data. Optionally, MIC or disk diffusion breakpoints can be overlaid on the plot.
Usage
amr_complexUpset(
  binary_matrix,
  min_set_size = 10,
  mic_disk = "mic",
  remove_NAs = TRUE,
  gene_determinants = NULL,
  colour_by = "pheno",
  plot_breakpoints = FALSE,
  organism = NULL,
  break_guide = "EUCAST 2024",
  break_type = "ECOFF",
  drug = NULL,
  sort_intersections_by = "degree",
  sort_intersections = "ascending",
  show_intersect_size = TRUE,
  intersect_counts = TRUE,
  heights = NULL,
  colour_values = c(S = "#66c2a5", I = "#fdae61", R = "#d53e4f")
)
Arguments
- binary_matrix
A binary matrix where rows represent samples and columns represent genetic determinants or phenotypic resistance data.
- min_set_size
The minimum size of a set to be included in the plot. Default is 10.
- mic_disk
A character string specifying whether to use 'mic' or 'disk' for the y-axis. Must be either
"mic"or"disk". Default is"mic".- remove_NAs
Logical. If
TRUE, removes rows with missing values in the selectedmic_diskcolumn. Default isTRUE.- gene_determinants
A character vector specifying which genetic determinants to include. If
NULL, all genes are used. Default isNULL.- colour_by
A character string specifying the column used for colour mapping in the plot. Default is
"pheno".- plot_breakpoints
Logical. If
TRUE, overlays MIC or disk diffusion breakpoints on the plot. Default isFALSE.- organism
A character string specifying the organism, used when plotting breakpoints.
- break_guide
A character string specifying the breakpoint guideline (e.g.,
"EUCAST 2024"). Default is"EUCAST 2024".- break_type
A character string specifying the breakpoint type (e.g.,
"ECOFF"). Default is"ECOFF".- drug
A character string specifying the antimicrobial agent to be analysed.
- colour_values
A named vector specifying colours for different resistance categories (
S,I,R). Default isc(S="#66c2a5", I="#fdae61", R="#d53e4f").
Examples
# Example usage:

ecoli_geno <- import_amrfp(ecoli_geno_raw, "Name")
#> Input is already a dataframe.

binary_matrix<- get_binary_matrix(geno_table=ecoli_geno,
              pheno_table=ecoli_ast,
              antibiotic="Ciprofloxacin",
              drug_class_list=c("Quinolones"),
              sir_col="pheno",
              keep_assay_values=TRUE,
              keep_assay_values_from = "mic"
           )
#> [1] "Some samples had multiple phenotype rows, taking the most resistant only"
#> [1] "Defining NWT using ecoff column provided: ecoff"

amr_complexUpset(binary_matrix)
#> Warning: Removed 171 rows containing non-finite outside the scale range (`stat_sum()`).